|
|
||
Speech production and perception tools for real-time assessment, analysis and therapy
Related pages
system requirements
full system
specification
PDF Downloads:
Speech Studio Factsheet
Summary Sheet with picture
|
Speech Studio |
|
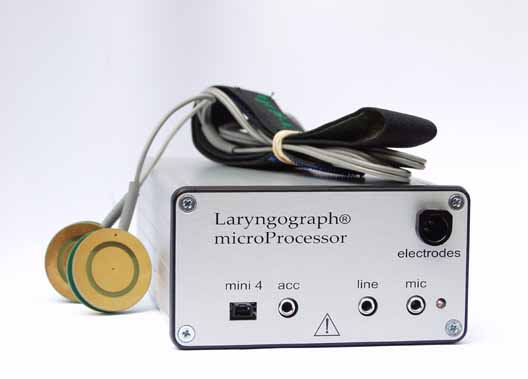
Laryngograph's microProcessor Speech Studio is now available in "pocket" format! The new Digital Laryngograph® and a laptop computer are all that is required to use Speech Studio. Portable and easy to use, this makes objective voice measurement even easier!
Speech Studio is a software and hardware package, which has been specially designed for phoneticians and speech scientists, and for quantitative work by ENT clinicians and SLTs. It supports data recording direct to hard disk, real-time displays, and instantaneous quantitative analysis and pattern target mode for speech training.
Speech Studio software is Windows-based, user friendly, and feature rich. The figure above shows a typical main interface which can be tailored for individual needs. The number and type of displays can be easily set by simply checking the display name in the Hide/Show group box on the left side of the main frame window.
With Speech Studio, you can not only work on sustained sounds but also on connected speech. When data is recorded, it is always easy to edit and play back. You can select a voiced segment and make jitter and shimmer measurements. The figure below shows an example of vocal profile analysis results.
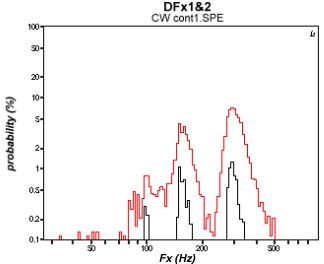
Distributions are amongst the other useful graphs supported. The figure (right) shows a first order distribution and a second order distribution of period-by-period fundamental frequencies (Fx). The red trace shows first order distribution, and the black traces shows second order for a pathological voice.
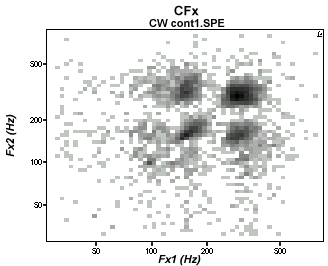
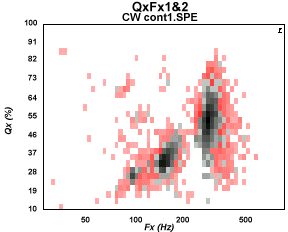
The two pathological voice figures below, show an Fx cross-plot (left) and two superposed connected speech phonetograms (right). The first order is in red and the core second order showing the regular heart of the sample is in black.
|

Laryngograph Ltd, 78 Manor Road, Wallington,
Greater London, SM6 0AB, United Kingdom
Tel: +44 20 87733910, Fax: +44 20 8835 2920
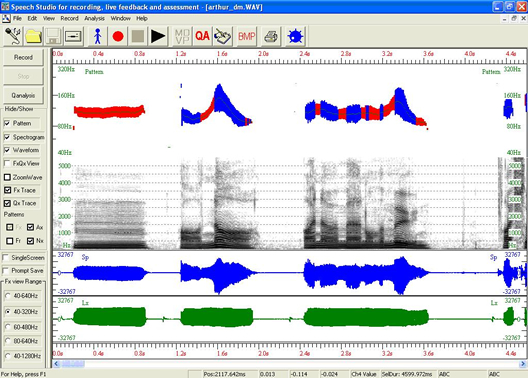
![In the figure pattern, spech waveforms, nasality and Qx [contact phase] traces are shown.](img/spstud1.jpg) In
the figure on the right, pattern, spech waveforms,
nasality and Qx [contact phase] traces are shown.
In
the figure on the right, pattern, spech waveforms,
nasality and Qx [contact phase] traces are shown.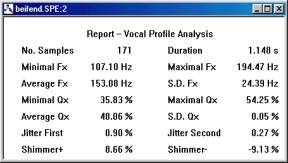 Speech
Studio performs a comprehensive range of quantitative
analyses on connected speech (not just sustained
sounds). These operate on all the speech elements
captured - fundamental frequency, amplitude, contact
quotient, nasality, and frication - both individually
and in combination.
  One type of graph is a summary of time durations.
This figure (right) shows the proportions of time
durations for four different speech pattern elements,
friction (Fr), voiced sound (Vx), silence (Sx) and
nasal sounds (Nx).